8/3/07

Trader's Corner: Finding The Magic Mix Of Fundamentals And Technicals

Anyone who has relied on "hot" news or company fundamentals to buy a stock knows that this practice often leads to disappointing results. The reason is simple. Fundamental analysis data lags the market. Earnings news can be as much as over a month old when released. In the majority of cases, by the time news announcements are made, the stock has usually already made its move.

Also, what if the fundamentals change? Most fundamental investors maintain the belief that it is better to hold onto a stock through thick and thin and hope the company recovers once better times return. But as we saw through the 2000 – 2002 bear market correction and all bear markets before it, this approach can lead to complete disaster.

The continued popularity of the traditional buy-and-hold strategy is due in no small part to the 18-year bull that ended in 2000. During this market, the buy-and-hold approach to investing worked great, but then so did throwing darts. It was only when the market turned to a bear that the fundamental flaw in this method became obvious.


Lastly, fundamental investors generally do not use stop losses to protect profits. Worse, those adopting a value approach employ the practice of averaging down, using the rationale that the cheaper a stock gets, the greater its value. This only serves to compound losses when a market is in plunge mode.

At the opposite end of the spectrum, technical analysis ignores fundamentals altogether and focuses strictly on technical indicators and chart patterns. While an excellent method of short-term trading, it can lead to losses in longer-term trades unless the trader continually readjusts profit targets and stop-losses. Also, this type of on-going maintenance may not be everyone's cup of tea and can cause unnecessary stress.

In reality, unless you are a pure technical trader employing very short time horizons to day trade or swing trade, using one method of analysis while ignoring the other is like trying to win a boxing match with one hand tied behind your back.

So what is the best combination of technical and fundamental methods for the busy trader or investor, and how does one become a truly proficient "technimental" trader (which you can read more about in "Charting Your Way to Better Returns")?

Time Frame Target
In the article entitled "Trader's Corner – Shoot for the Moon…And Hit It!," I highlight the techniques of stock-trading record-holder Dan Zanger. Dan is a pedal-to-the-metal kind of swing trader who likes to buy highly volatile stocks on margin that are in the process of either breaking out or breaking down. He gets in quick and may stay in anywhere from a few hours to a number of days or in some cases, even weeks.

"If you're a day trader who takes positions for a few minutes to a few hours, fundamentals are pretty much meaningless," he says. "Their importance in the decision making process is directly proportional to the anticipated time to be spent in a position."

However, using the premise 'cut losses short and let your profits ride' means that unless the trade goes against you at the beginning, it's hard to know exactly how long to hold the position. As long as it's moving up on volume, Zanger holds on.

The moral is that even on anticipated shorter-term trades of a day or so, it's important to have at least a rudimentary understanding of the fundamental strengths (and weaknesses) of a company because, if you are lucky, it will turn into a longer-term proposition.

What's a CANSLIM?
Zanger takes what he calls a top-down approach when looking for stocks to buy. First he looks for stocks putting in "interesting chart patterns on increasing volume." If the stock is acting frisky, there is generally a fundamental reason why; often institutions are accumulating the stock and the chart pattern is simply proof of this.

Zanger is a firm believer in the CANSLIM strategy, as this magic formula contains almost everything he needs to know about a company before buying it. There is a summary of the CANSLIM formula in William O'Neil's essential market bible called How to Make Money in Stocks: A Winning System in Good Times and Bad. (You can also read about CANSLIM in "Guide to Stock Picking Strategies.") O'Neil recommends that you buy only companies exhibiting certain fundamental and technical characteristics. Zanger has added some of his own criteria, and, interestingly, he has discovered over the years that stocks demonstrating interesting chart patterns on volume very often turn out to fulfill most if not all of the CANSLIM criteria. Here is a summary of the CANSLIM criteria, including the way Zanger uses them.

C = Current Quarterly Earnings/Share Growth - For Zanger, this must be up a minimum of 40% and quarterly sales accelerating at 40% or better. (In the book, O'Neil recommends, "earnings must be up 18 – 20%, the higher the better." Zanger requires double this as a minimum.) O'Neil also recommends that quarterly sales be accelerating or up 25%. As well, Zanger looks for companies with both earnings and revenues that demonstrate a continual quarter-over-quarter sequential expansion, known as "ramping up." In retailers, however, he looks for year-over-year expansion (due to the seasonal volatility of the industry).

A = Annual Earnings Growth - Studies by O'Neil's Investor's Business Daily show that winning stocks over the last 50 years had a return on equity (ROE) of 17% or more. Any CANSLIM-worthy stock should demonstrate this kind of ROE in each of the last three years. The higher the annual growth, the better the candidate.

N = New Products, New Management, and New Highs – The company should offer new products/services, with new management and/or industry innovations. A pivotal technical consideration of this point is to buy only stocks that are emerging from basing chart patterns and that have put in a new stock-price high out of the base or consolidation. Zanger looks for companies that have a global domination in their market space and that are also "under-known and under-owned." This means institutions that don't yet have these stocks in their portfolio are to become major buyers, at which point they create demand for the stock and in turn push up the stock price.

S = Supply and demand in share volume/shares that float - The supply part (shares outstanding) is of less importance here than demand. The company should demonstrate increasing volume as price moves out of a basing chart pattern such as a cup and handle, saucer bottom, or head and shoulders bottom. Other patterns such as flags or pennants and bullish wedges also represent excellent buying opportunities when the breakouts are accompanied by greater-than-average volumes. Other major factors are the total number of shares that the public can buy, and this is known as the float. A small number of shares that float means that fewer shares have to be bought to push up the stock price. Dan likes to see stocks with 3 million to 100 million shares that float. TASR, one of Dan's big winners in 2003-2004, started out with just 3 million shares that floated on its 5000% run in one year.

L = Leader (or Laggard)? - Buy market, sector and industry leaders. Sell laggards. Own the industry leaders and sell them when they no longer lead. This also applies to the sectors and groups in which they reside.

I = Institutional sponsorship - Look for stocks with a good degree of institutional (= professional) participation. This includes those with a higher degree of corporate executive ownership.

M = Market direction - As much as 70% of a stock's price movement is determined by the direction of the overall market. Even a winner will be fighting a strong current to get to higher prices in a market that is tanking. It is best to be long winners in a bull market (and short losers in a bear market).

Other fundamentals of importance include:
  1. Short interest – A large short interest gives a clue as to what other traders are doing. A general rule of thumb is to avoid stocks with more than 5% of the float held short.

  2. Insider selling – Insider activity can often provide valuable indications of where a stock may be heading. If insiders are buying for the first time in a number of months, they might be accumulating stock in anticipation of a positive event. If they are dumping, what do they know that you don't? More on this in my article "Can Insiders Help You Make Better Trades?"

Once a stock has been identified as a potential CANSLIM candidate, Zanger watches it for a few days to make sure it is not simply a one-day wonder. Some of his big winners in 2003 -2004 have included Research in Motion (RIMM), E-Bay (EBAY), Kmart (KMRT), Taser, INC. (TASR), NVE Corp (NVEC), PalmOne (PLMO), and Travelzoo (TZOO).

Zanger offers one important caveat: while it's true that most stocks that he trades are CANSLIM stocks, there are two important exceptions that show why checking the fundamentals is so important. Firstly, he says that Biotechs often act like CANSLIM stocks but don't have earnings growth and other positive criteria. And secondly, he says that near the end of a major bull run in the markets, after most of the quality stocks have already moved and are starting to exhaust themselves, the trash stocks will get pushed higher as investors scramble to find the "next big thing." A rising tide lifts all boats including those that don't have the fundamentals behind them. Loading up on these trash stocks late in the game can lead to serious losses and a situation that can be avoided by looking at the fundamentals.


Automating the Process
Although Zanger's charting program of choice is AIQ, there is a tool that, combining technicals and fundamentals into one package, will appeal to the technimental trader. Called High Growth Stocks, the program uses data from Quotes-Plus to provide charts on more than 8,000 stocks. It streamlines the process of looking at technicals and fundamentals together. Custom filters that include fundamental criteria can be used to scan for stock candidates meeting a number of fundamental and technical criteria.

Research in Motion, developer of the ubiquitous technology toy "Blackberry," is shown in figure 1. It has been a classic CANSLIM prospect. First, RIMM's Blackberry now has complete product domination in first world countries and is revolutionizing the personal digital appliance market. It can send and receive e-mail, make phone calls, and perform many of the functions of a computer in the palm of your hand. And, most importantly, it is the market leader in this field.
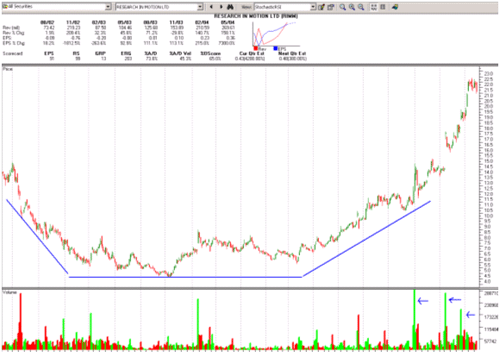
Figure 1 – Research in Motion (RIMM) showing basing saucer pattern (blue lines) followed by breakouts on volume (lower blue arrows). Earnings in upper chart window show a 3600% increase in the current quarter. Chart provided by http://www.highgrowthstock.com. Data by http://www.quotes-plus.com/

Even after a split in early 2004, the stock has only a total of 117 million shares in the float and only 158 million outstanding. In 2001-03, it showed an interesting long-term saucer pattern after which it experienced a number of impressive volume spikes. It also demonstrated impressive revenue and earnings growth. As we see in the upper High Growth Stocks window in figure 1, quarterly earnings grew from 92% per quarter in mid-2003 to 7300% by mid-2004.
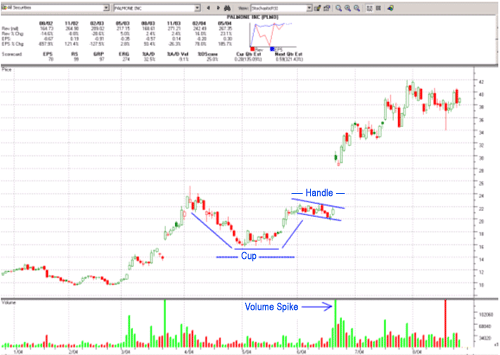
Figure 2 – PalmOne Inc. (PLMO) showing cup and handle pattern followed by breakout on volume. Earnings info in upper window. Chart provided by http://www.highgrowthstock.com. Data by http://www.quotes-plus.com/

PalmOne Inc., candidate number 2, also demonstrated the necessary CANSLIM criteria including increasing earnings (upper window), a cup and handle chart pattern followed by a volume spike the pattern breakout.

More Words of Wisdom
Bill O'Neil's How to Make Money in Stocks Desk Diary 2004 is another essential tool for the serious trader or investor and offers sage wisdom on how to apply the CANSLIM formula 365 days of the year. It is a valuable source of information and goes a long way in dispelling a number of common misconceptions.

Here is what O'Neil has to say on P/E ratios:

"Never buy a stock solely because the P/E ratio makes it look like a bargain. There is usually a good reason why P/Es are so low, and there is no golden rule in the stock market that protects a stock that sells at 8 or 10 times earnings from going even lower."

"High P/Es that were great bargains--Xerox sold for 100 times earnings in 1960--before it advanced 3,300%. America Online sold for over 100 times earnings before it increased 14,900% in November 1994 to its top in December 1999."

"During the 1990-95 period, the real leaders began with average P/E of 36 that expanded into the 80s."
ADVERTISEMENT
In this exclusive must-read free report compliments of ChartAdvisor.com you’ll learn 5 of the most reliable chart patterns for delivering explosive and profitable trading ideas.


Here is what he has to say on volume:

"Major changes in volume can give you significant clues. A stock that trades up one point on 600% of its average volume alerts you to emerging professional interest in that stock."

And on chart patterns:

"Cup patterns can last from seven to as long as 65 weeks, but most are three to six months."

"Handles in a cup-with-handle pattern must form in the upper half of the overall base structure.... The handle should also be above the stock's 200-day moving average line."

Time – Your Most Precious Commodity
Dan Zanger has taken 20 years to hone his stock picking skills to a science, and his research often took days. But thanks to modern technology and the availability of some powerful programs and data sources, it no longer has to take that long to find all-around winning stock candidates. It is now possible to obtain that amount of information in minutes, for those who know how.

Zanger scans 1,400 stocks manually nightly to look for interesting candidates. He still must do a little manual digging to see if new prospects meet the requirement of offering a new product, management, or service, but that doesn't take long; the process is far faster than it used to be. He only needs to look at the chart and seven pieces of data for each. He is done his homework in anywhere from 30 to 60 minutes a day.

Conclusion
Those who do not use technical and fundamental data together often miss crucial pieces in the trading puzzle, leaving them at a distinct disadvantage against their more technically proficient and well-informed competitors. Purists who ignore either fundamental or technical information are making a mistake that could end up costing them plenty.

By adopting Zanger's top-down approach, locating stocks that are acting unusually frisky, and then examining their underlying fundamentals, traders or investors can find winning stocks in all types of market conditions in as little time as it takes to watch your favorite TV program. It is a lot more productive and rewarding to boot. No longer will you be at the mercy of bear or trading range markets.

So what are you waiting for?

By Matt Blackman

Matt Blackman, the host of TradeSystemGuru.com, is a technical trader, author, keynote speaker and regular contributor to a number of trading publications and investment/trading websites in North America and Europe. He also writes a weekly market letter.
Day Trading Strategies For Beginners

When people use the term "day trading", they mean the act of buying and selling a stock within the same day. Day traders seek to make profits by leveraging large amounts of capital to take advantage of small price movements in highly liquid stocks or indexes. Here we look at some common day trading strategies that can be used by retail traders.


Entry Strategies
Certain stocks are ideal candidates for day trading. A typical day trader looks for two things in a stock: liquidity and volatility. Liquidity allows you to enter and exit a stock at a good price (i.e. tight spreads and low slippage). Volatility is simply a measure of the expected daily price range - the range in which a day trader operates. More volatility means greater profit or loss. (To learn more, see Day Trading: An Introduction.)

One day trader favorite is Sun Microsystems (Nasdaq: SUNW). The stock is cheap ($4.38 at the time of writing), liquid (almost 50 million shares traded daily) and very volatile (as can be seen by looking at its chart). This type of stock is ideal for the retail day trader.

Once you know what kind of stocks you are looking for, you need to learn how to identify possible entry points. There are three tools you can use to do this:

  • Intraday Candlestick Charts - Candles provide a raw analysis of price action.
  • Level II Quotes/ECN - Level II and ECN provide a look at orders as they happen.
  • Real-Time News Service - News moves stocks. This tells you when news comes out.
We will look at the intraday candlestick charts and focus on the following three factors:

  • Candlestick Patterns - Engulfings and dojis
  • Technical Analysis - Trendlines and triangles
  • Volume - Increasing or decreasing volume
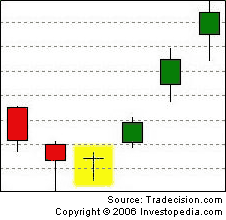
There are many candlestick setups that we can look for to find an entry point. If properly used, the doji reversal pattern (highlighted in yellow in Figure 1) is one of the most reliable ones.


Figure 1 - Looking at candlesticks - the highlighted doji signals a reversal.

Typically, we will look for a pattern like this with several confirmations:

  1. First, we look for a volume spike, which will show us whether traders are supporting the price at this level. Note that this can be either on the doji candle, or on the candles immediately following it.
  2. Second, we look for prior support at this price level. For example, the prior low of day (LOD) or high of day (HOD).
  3. We look at the Level II situation, which will show us all the open orders and order sizes.
If we follow these three steps, we can determine whether the doji is likely to produce an actual turnaround, and we can take a position if the conditions are favorable. Typically, entry points are found using a combination of these three tools.


Finding a Target
Identifying a price target will depend largely on your trading style. Here is a brief overview of some common day trading strategies:

Strategy


Description
Scalping


Scalping is one of the most popular strategies, and it involves selling almost immediately after a trade becomes profitable. Here the price target is obviously just after profitability is attained.
Fading


Fading involves shorting stocks after rapid moves upwards. This is based on the assumption that (1) they are overbought, (2) early buyers are ready to begin taking profits and (3) existing buyers may be scared out. Although risky, this strategy can be extremely rewarding. Here the price target is when buyers begin stepping in again.
Daily Pivots


This strategy involves profiting from a stock's daily volatility. This is done by attempting to buy at the low of the day (LOD) and sell at the high of the day (HOD). Here the price target is simply at the next sign of a reversal, using the same patterns as above.
Momentum


This strategy usually involves trading on news releases or finding strong trending moves supported by high volume. One type of momentum trader will buy on news releases and ride a trend until it exhibits signs of reversal. The other type will fade the price surge. Here the price target is when volume begins to decrease and bearish candles start appearing.

You can see that, although the entries in day trading strategies typically rely on the same tools used in normal trading, the exits are where the differences occur. In most cases, however, you will be looking to exit when there is decreased interest in the stock (indicated by the Level II/ECN and volume). (For further reading, see Introduction To Types Of Trading: Momentum Traders and Introduction To Types Of Trading: Scalpers.)

Determining a Stop-Loss
When you trade on margin, you are far more vulnerable to sharp price movements than regular traders. Therefore, using stop-losses is crucial when day trading. One strategy is to set two stop losses:

  1. A physical stop-loss order placed at a certain price level that suits your risk tolerance. Essentially, this is the most you want to lose.
  2. A mental stop-loss set at the point where your entry criteria are violated. This means that if the trade makes an unexpected turn, you'll immediately exit your position.
Retail day traders usually also have another rule: set a maximum loss per day that you can afford (both financially and mentally) to withstand. Whenever you hit this point, take the rest of the day off. Inexperienced traders often feel the need to make up losses before the day is over and end up taking unnecessary risks as a result. (To learn more, see The Stop-Loss Order - Make Sure You Use It.)


ADVERTISEMENT
In this exclusive must-read free report compliments of ChartAdvisor.com you’ll learn 5 of the most reliable chart patterns for delivering explosive and profitable trading ideas.


Evaluating and Tweaking Performance
Many people get into day trading expecting to make triple digit returns every year with minimal effort. In reality, around 80% of day traders lose money. A recent (January 2005) behavioral finance study of the Taiwanese stock market conducted by professors at the University of Taipei and the University of California suggests that "less than 20% of day traders earn profits net of transaction costs". Most of these people would be better off putting their money on the roulette table than using it for day trading! However, by using a well-defined strategy that you are comfortable trading, you can improve your chances of beating the odds.

How do you evaluate performance? Most day traders evaluate performance not so much by a percentage of gain or loss, but rather by how closely they adhere to their individual strategies. In fact, it is far more important to follow your strategy closely than to try to chase profits. By keeping this mindset, you make it easier to identify where problems exist and how to solve them.

Conclusion
Day trading is a difficult skill to master - well over 50% of those who try it fail. But the techniques described above can help you create a profitable strategy and, with enough practice and consistent performance evaluation, you can greatly improve your chances of beating the statistics.
By Justin Kuepper,
Access Investopedia's Forex Advisor FREE Report - The 5 Things That Move The Currency Market

Trading Without Noise

Noise removal is one of the most important aspects of active trading. By employing noise removal techniques, traders can avoid false signals and get a clearer picture of an overall trend. Here we take a look at different techniques for removing market noise and show you how they can be implemented to help you profit.

What Is Market Noise?
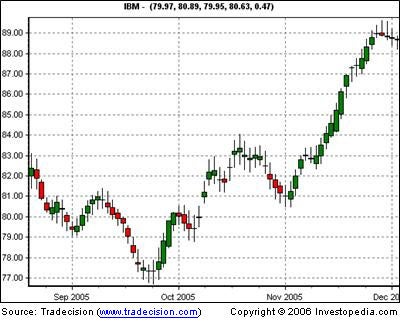
Market noise is simply all of the price data that distorts the picture of the underlying trend. This includes mostly small corrections and intraday volatility. To fully understand this concept, let's take a look at two charts - one with noise and one with noise removed:

Before noise is removed:

Figure 1

After noise is removed:

Figure 2

Notice that in Figure 2, there are no longer any areas in which the trend is not easily seen, whereas in Figure 1, it is often difficult to identify whether the trend is changing on some days. The technique used in this chart is averaging - that is, where the current candle factors in the average of prior candles in order to create a smoother trend. This is the aim of noise reduction: to clarify trend direction and strength. (For more insight, check out Short-, Intermediate- And Long-Term Trends.)

Let's take a look at how we can determine these two factors and combine them to create reliable charts that are easier to read.

Isolating Trend Direction
Isolating trend direction is best done through the use of specialized charts designed to eliminate minor corrections and deviations and only show larger trends. Some of the charts (such as Figure 2 above) simply average prices to create a smoother chart, while others completely recreate the chart by taking only trend-affecting moves into consideration.

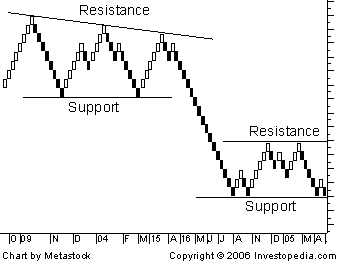
Renko Charts
One example of a chart type that only uses trend-affecting moves is the Renko chart, named after the Japanese term "renga", meaning "brick". Renko charts isolate trends by taking price into account but ignoring time.

They are created by using a simple three-step process:
  1. Choose a brick size. This is simply the minimum price change required for a new brick to appear.
  2. Compare the current day's close with the high and low of the previous brick.
  3. If the closing price is higher or lower than the top of the previous brick by at least the size of one brick, one or more bricks are drawn in the next column in the respective direction.
Let's take a look at an example:


Figure 3

As you can see, it is much easier to identify trends on these charts than on traditional candlestick charts. Further noise reduction can be obtained by increasing the size of the bricks; however, this will also increase the intra-trend volatility - make sure that you have enough capital to withstand this volatility.

Overall, Renko charts provide an excellent way to isolate trends, but they are limited by the fact that they don't provide a way to determine trend strength other than simply looking at the trend length, which can be misleading. We'll take a look at how to determine trend strength later in the article.

Heikin-Ashi Charts
A second type of chart that can be used for noise reduction is the Heikin-Ashi chart. These charts use a strategy similar to the charts seen in Figs. 1 and 2: they factor in the current bar with an average of past bars in order to create a smoother trend. This process creates much smoother price patterns that are much easier to read. (For more information and examples, see Heikin-Ashi: A Better Candlestick.)

These are the charts most commonly used when reducing market noise; they can easily be used with other indicators because they don't factor out time. Another added benefit is that they also smooth out the indicator because the price bars are used as indicator inputs. This can help make indicators far easier to read.

Kagi Charts
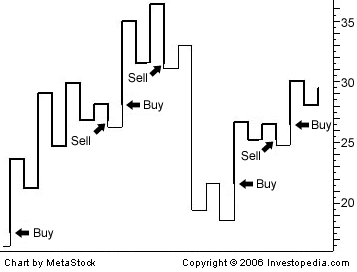
Kagi charts are designed to show supply and demand through the use of thin and thick lines. New lines are created whenever a new high or low is established. By isolating highs and lows, it becomes much easier to see the larger trends.

Let's look at an example:


Figure 4

Trending times are then defined as times when demand exceeds supply (uptrend) or supply exceeds demand (downtrend). Finding trends becomes as easy as looking for thick or thin lines.

These charts are also excellent for noise reduction, but they are limited because they can't determine trend strength other than by measuring the move lengths, which can be misleading.

Determining Trend Strength
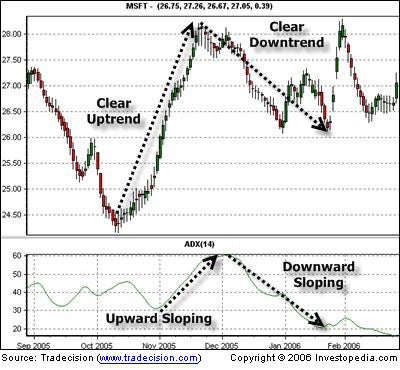
Trend strength is best gauged through the use of indicators. For the purposes of this article, we will take the most popular indicator - directional movement index (DMI) - and its derivative, the average directional movement index (ADX).

The DMI indicator is the most widely used trend strength indicator. This indicator is divided into two parts: +DI and -DI. These two indicators are then plotted to determine overall trend strength.

The ADX indicator is simply the averaging of the two DMI (directional movement index) indicators (+/-) to create a single line that can be used to instantly determine whether a price is trending or dormant. (For more on this, read Directional Movement - DMI.)

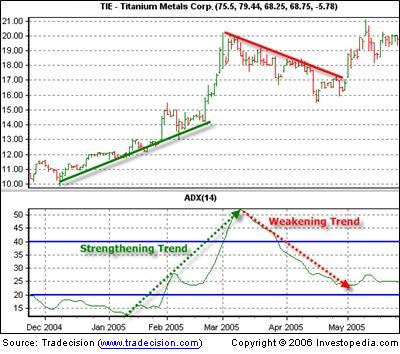
Let's see an example of how this can be useful:


Figure 5

As you can see, the slope increases at a greater rate when the trend is stronger and at a lesser rate when the trend is weaker. Typically, the ADX is set at a 14-bar range, with 20 and 40 being the two key points. If the ADX is rising above 20, it signifies the beginning of a new trend. If it rises above 40, that means the trend is likely about to end. As you can see from Figure 5, it can give you a fairly accurate read.

Creating a Usable Strategy
Although the ADX appears to work well on its own, market volatility can cause second-guessing and false signals. However, when combined with chart types that more easily highlight trends, it becomes a lot easier to identify profitable opportunities.


ADVERTISEMENT
In this exclusive must-read free report compliments of ChartAdvisor.com you’ll learn 5 of the most reliable chart patterns for delivering explosive and profitable trading ideas.


Using a combined analysis is as simple as determining whether the chart pattern's sentiment is the same as the indicator's sentiment. Therefore, if you are using Heikin-Ashi and ADX, simply check to see what the trend direction is on the chart and then take a look at the trend strength shown on the ADX. If both are telling you that there is a strong trend, then it may be a good idea to enter.

Here's an example:


Figure 6

Here we can see the trends are smoothed out by the use of averaging techniques (like Heikin-Ashi) and are being confirmed through the use of indicators (like ADX). This gives us a clear and reliable picture of the current market situation, without any unnecessary clutter (market noise).

Conclusion
As you can see, chart analysis is much easier when using noise-removal techniques. They can help you avoid costly false signals and other mistakes, while allowing you to quickly and accurately locate and capitalize on trends.
By Justin Kuepper,
Access Investopedia's Forex Advisor FREE Report - The 5 Things That Move The Currency Market

Trading Failed Breaks

You've been told time and time again to trade breakouts and breakdowns. Countless chart patterns exist to help you pinpoint exact entries and place effective stops. Knowledge of these patterns and strategies is commonplace among retail traders. And indeed, the strategies work in most situations - if they didn't, then technical analysis would not work. However, this type of predictable behavior begs the question: why doesn't someone take the other end of the trade? Why wouldn't someone purposely break through the predictable stops, knowing that it would crash the price?

The truth is that this situation does take place on a regular basis. It's called a failed break, and the resulting signal is often more reliable than the original breakout or breakdown. Here we take a look at what constitutes a failed break, and show how you can turn a potentially disastrous position into a profitable one.

Anatomy of a Failed Break
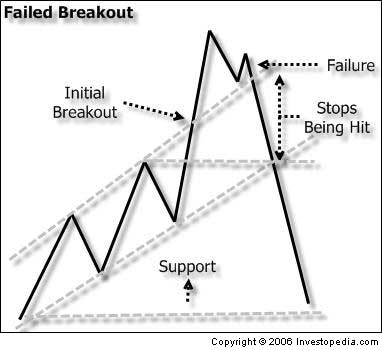
To get a better idea of how to trade these failed breaks, let's first take a look at the anatomy of a failed breakout:

  1. A breakout occurs.
  2. The breakout fails by dropping below the new support (old resistance).
  3. As a result, stops of short-term traders are hit at predictable levels.
  4. Triggering these stops causes the price to drop (similar to the way it drops after a short squeeze, as there is a frantic search for buyers in both cases).
  5. The drop slows down after stops are hit and covered.
  6. The drop stops and reverses after the price reaches a new major support level, or a fundamental reason causes a reversal.
These are the key validation points:

  • The volume is there to confirm the stops being hit.
  • The original chart pattern showing the breakout is accurate.
Trading Failed Breaks
When a failed break occurs, you are on one of two sides. Either you traded the breakout and are looking to exit your position, or you are looking for an entry after a failed breakout occurs.

If you traded the breakout and are caught on the wrong side of the trade, you should try to exit before the price hits the predictable stop-loss levels. This will help you avoid slippage, which can be seen in illiquid stocks when failed breaks occur. Then you can look to re-enter in the opposite direction, assuming that you are sure that the breakout failed (i.e. the movement is not simply market noise).

Let's look at an example of a trade setup to illustrate how a typical trade might go:


Figure 1

Here (Fig. 1) we are looking to take a short position as soon as the breakout fails. Then we would sell half our position after the initial drop, at the top horizontal gray line. This is to take some money off the table in case a rebound occurs. Finally, we would sell the remainder of our position at the next major support level, indicated by the lower horizontal gray line.

Other Techniques
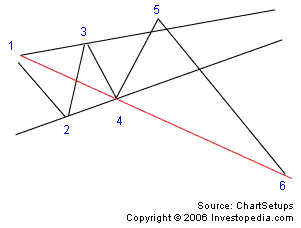
There are also some strategies that rely on failed breaks to validate a pattern. The most popular example of this is the Wolfe Wave pattern. (To learn more, see Advanced Channeling Patterns: Wolfe Waves And Gartleys).

Here's an example of a Wolfe Wave:


Figure 2

Notice that the fifth wave of the Wolfe Wave pattern mandates that a breakout take place, which is then followed by a large move in the opposite direction to point 6. This pattern is surprisingly accurate, and makes good use of the accuracy of the failed break phenomenon.

Examples
Let's look at a few more examples to further reinforce these concepts.

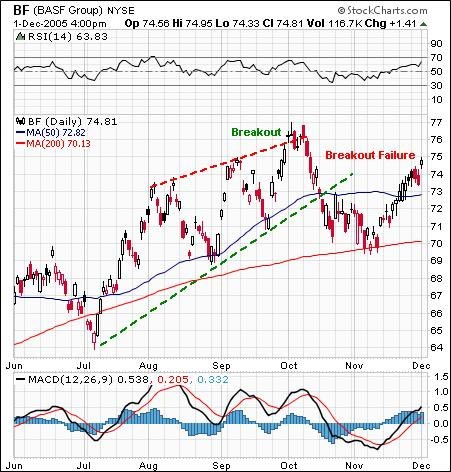
In Figure 3, we see an example of a Wolfe Wave pattern that appeared on the chart of BASF Corporation (BASF) from late July 2005 to late October 2005.


Source: StockCharts.com
Figure 3

Now, we notice that the stock appeared to break out above the upper channel, creating a new high. The stock then quickly fell below the breakout level, creating a failed breakout. Using the Wolfe Wave principles, we can calculate the breakout as ending around the $70 level by connecting points 1 and 4.

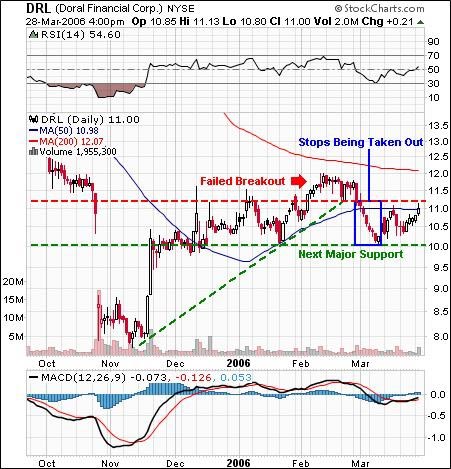
In Figure 4, we see an example of an ascending triangle pattern that appeared on the chart of Doral Bank (DRL) from November 2005 to March 2006.


Source: StockCharts.com
Figure 4


ADVERTISEMENT
In this exclusive must-read free report compliments of ChartAdvisor.com you’ll learn 5 of the most reliable chart patterns for delivering explosive and profitable trading ideas.


Notice that DRL breaks out from an ascending triangle/horizontal channel formation. This turned out to be a failed breakout as the stock quickly plummeted after dropping below the newly created support level. This caused a series of stops to be hit that dropped the price down to the next major support at $10.

In both of these examples, we can see that a failed breakout produced a quick move in the opposite direction. In the Wolfe Wave example, we used the Wolfe Wave principles to derive an exact turning point. Meanwhile, in the ascending triangle formation, we were able to pinpoint support by looking at the next major support. (For further reading, see Triangles: A Short Study In Continuation Patterns and Continuation Patterns - Part 2 and Part 3.)

Conclusion
As we've seen, failed breaks can offer great opportunities to profit. As more and more retail traders embrace the same predictable strategies, these failed breaks will likely become increasingly apparent in the marketplace. It is important to learn to identify them in order to save money when your breakout plays turn bad, and also to tap into potential profit based on the predictable behavior of others.

By Justin Kuepper,
Access Investopedia's Forex Advisor FREE Report - The 5 Things That Move The Currency Market

What Can Traders Learn From Investors?

What are investors doing that traders should do too? Despite the vastly different strategies that these two groups employ, there are a handful of hints that a trader could successfully take from the typical long-term investor - after all, both groups are just looking to buy low and sell high. In this article, we'll take a look at earnings, market hype, buy-and-hold strategies and diversification - if you think these principles can't be used by traders, think again! Read on to find out how a few tips from investors can help you make better trades.


Earnings Still Mean Everything
If sound trading strategy can be boiled down to just one key idea, it's this: You want to move before the rest of the market does. Sounds too simple, doesn't it? However, no matter what technique a trader is using, all he or she is really trying to do is find current opportunities that nobody else has found yet. Later, when others realize the same value, their buying efforts will push stocks higher or lower, as the case may be. There are certainly many techniques to find those opportunities, but they're all ultimately designed to beat the crowd. (For further reading, see Day Trading Strategies For Beginners and Day Trading: An Introduction.)

The goal for traders is to deduce what investors are likely to do to a stock over a particular time frame - usually a short time frame. Now ask yourself, what single piece of data is most scrutinized by the investing crowd? The answer: earnings. The only compelling reason anybody would want to own shares in a company for the long haul is that the company has at least the potential earnings of similar investment options. If a company can't provide adequate compensation for the risk that investors must take on, investors have no real reason to continue holding that stock. If a company can provide risk-commensurate returns, investors will be scrambling for its stock. The problem is that investors can't do all this buying and selling in a very orderly fashion. In fact, the market can get downright disorderly when investors get too emotional about earnings (future or present). When the investing public makes a mistake and provides the trader with an opportunity to take advantage of the likely correction, this is the so-called "sweet spot" for traders.

As a trader, keeping tabs on earnings could provide an edge when it comes to being able to answer two key questions about a company: First, is the company profitable, and what kind of earnings growth are they achieving? Second, and perhaps most important, what kind of response will any earnings news create? It pays to find out whether the company has a history of over-promising and under-delivering as well as how investors typically behave before, during and after earnings news. Also keep in mind that individual stocks have 'groupies' that create reasonably predictable movement patterns around earnings. (Form more information, check out Earnings Forecasts: A Primer and Everything You Need To Know About Earnings.)

Hype Can Defy The Odds
As any trader will tell you, trading is a game of odds, not a game of logic. That's why most traders use some sort of data-oriented or charting software. These programs help traders weigh the odds that a particular event will actually happen. In fact, the more mechanical the trading system, the more effective it usually is.

However, there is a flaw in the methodology. The odds that a trader seeks to define are largely based on history. For instance, a chart-watching technician is looking for particular historical patterns that have repeatedly led to the same result. When that same pattern is seen again in the future, the trader will act on the assumption that the same result will yet again be achieved. This gives the trader an idea of his or her odds for success on a given trade.

The flaw in the trading strategy becomes evident when things go awry. Take the year 1999, for instance. In that particular year, most traders were seeing all sorts of overbought chart patterns - a condition that indicates stocks have moved too high too quickly and are likely to pull back. Despite these signals, stocks didn't pull back until early 2000. Had a trader acted on those bearish signals, he or she would have been well into the red that year.

How can a methodology that works so well in most cases end up working so poorly in others? In many cases, hype and hysteria can overcome odds and tendencies and the historical patterns used to calculate the odds don't account for the kind of madness and euphoria we saw in 1999. In other words, trading software assumes that all trading environments are always the same when, in many cases, they're not. (For more insight, see The Madness Of Crowds and How Investors Often Cause The Market's Problems.)

As a trader, you absolutely must be able to recognize when a particular trading system is ineffective because of an abnormal trading environment. This is tough to do, as it bucks the discipline that most traders have worked hard to develop. However, this skill will save you - and your account balance - a lot of pain.

Buy and Hold - Not Just For Investors Anymore
The term 'buy and hold' has become largely interchangeable with long-term investing, but this doesn't mean that it's something a trader should be unwilling to do.

Traders don't just try to get in and out of trades as quickly as possible because they're trying to fit the mold - the issue is one of efficiency. Although everyone knows the market moves, we tend to forget that it moves in short bursts, rather than with a lot of daily consistency. Long-term investors are OK with this; they just want to stay invested so they can benefit from the points when stocks do move. Traders, on the other hand, are simply looking to avoid being in a stagnant stock or index. They prefer to find hot spots or stocks, making the most of time that would otherwise be wasted.

However, as a trader, it's easy to get into the habit of rapid entries and exits, even when you shouldn't. Take the run-up in crude oil prices between late 2001 and early 2006, for instance. Crude futures went from under $20 per barrel to over $70, for a gain of more than 250%. And if you had the full leverage that futures can provide, you would have done even better. Would a trader love to have an annualized gain of that magnitude? You bet! And it could have been achieved with only a handful of contract rollover transactions. However, trading oil futures in the short term (two weeks to three months) proved to be rather difficult over that four-year period. As choppy and erratic as oil prices were, most traders weren't able to reap the full benefit of the major move in oil prices. The most profitable oil futures choice, after commissions, may have been a buy-and-hold approach. It was, after all, a much more efficient trend than usual, and that's all traders are really looking for. (For more insight, read Ten Tips For The Successful Long-Term Investor.)

Larry William's said it best in his book "Long Term Secrets To Short-Term Trading" (1999). He points out that "the longer you can hold a trade, the more money you'll make." That's about the most effective way it can be said.

Diversification Is Always Prudent
Finally, traders should take a cue from the diversity investors seek, at least in a sense. A traditional investing strategy typically has a diversification component to it, primarily designed to limit volatility and provide more chances at holding a winner. Usually this involves spreading a portfolio out among all the major sectors, and sometimes dividing a portfolio up between different market capitalizations and countries. The idea, though, is simple - don’t put all your eggs in one basket. (For further reading, see Introduction To Diversification and Achieving Optimal Asset Allocation.)


ADVERTISEMENT
In this exclusive must-read free report compliments of ChartAdvisor.com you’ll learn 5 of the most reliable chart patterns for delivering explosive and profitable trading ideas.


Traders tend to be at the other end of the spectrum, solely focusing on just one market, or just a small set of securities. That, however, is still too much reliance on one kind of opportunity. For example, in a slow or sideways market, an index futures day trader may not have enough movement in any direction to even cover commissions. Or, in the same kind of involatile market, an option trader may find that time decay is far greater than the net gains of his or her slow-moving option trades. And even for stock swing traders, who focus on a particular group of names (like technology stocks), an individual equity really needs other stocks in the same sector or industry to move in the same direction. Otherwise, those trades make little to no progress.


In other words, any style, market, or strategy has a limited useful lifespan. While it's true that everything is cyclical and that hot markets that turn cold will eventually turn hot again, a one-trick pony may find that he or she is not getting enough viable opportunities over the course of a year to make it worth the effort. Most good traders have a couple of different ways to make monetary progress.

Conclusion
Nobody owns the corner on how to beat the market, but investors do understand several concepts that help reach that goal. Traders can use those same concepts too, and significantly improve their returns without significantly changing their approach.

For related reading, check out What Can Investors Learn From Traders?

Anticipation Vs. Prediction

Technical analysis is a useful tool that allows a trader to anticipate certain market activity before it occurs. These anticipations are drawn from previous chart patterns, probabilities of certain trade setups and a trader's previous experience. Over time, anticipation can eliminate the need for over-analyzing market direction as well as identifying clear, objective areas of significance. It isn't as hard as it sounds. Read on to find out how to anticipate the direction of a trend and follow it through to a profit.


Anticipation Vs. Prediction
Oftentimes, technical analysis is referred to as some sort of black magic used to time the market. However, what many outside of the financial world don't realize is that traders don't try to predict the future. Instead, they create strategies that have a high probability of succeeding - situations where a trend or market movement can be anticipated.

Let's face it - if traders could pick tops and bottoms on a consistent basis, they would be spending more time out in a Ferrari F430 convertible enjoying a nice stretch of highway. Many of you have probably tried picking tops and bottoms in the past and are through with the game. Perhaps you've already following in the footsteps of many professional traders, who attempt to find situations where they can anticipate a move and then take a portion of that move when the setups occur. (For more insight, see Trading Double Tops And Double Bottoms and Price Patterns - Part 4.)

The Power of Anticipation
When deciding on whether or not to make a trade, you likely have your own method of entering and exiting the market - you should decide on these before clicking the buy/sell button. Technical traders use certain tools such as the moving average convergence divergence (MACD), the relative strength index (RSI), stochastics or the commodity channel index (CCI) along with recognizable chart patterns that have occurred in the past with a certain measured result. Experienced traders will probably have a good idea of what the outcome of a trade will be as it plays out. If the trade is going against them as soon as they enter and it doesn't turn around within the next few bars, odds are that they weren't correct on their analysis. However, if the trade does go in their favor within the next few bars, then they can begin to look at moving the stops up to lock in gains as the position plays out. ('Bars' are used as a generic term here, as some of you may use candlesticks or line charts for trading.)

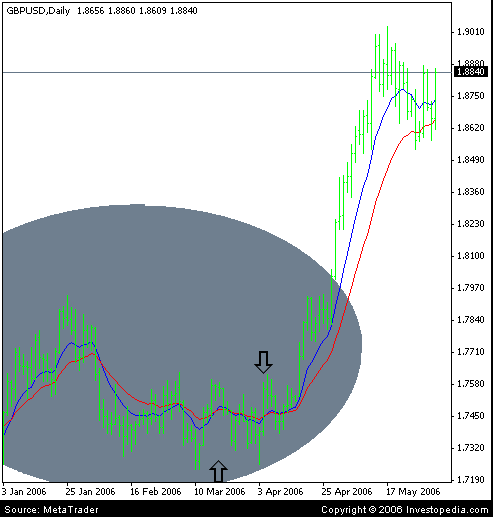
Figure 1 is an example of a trade taken on the British pound/U.S. dollar (GBP/USD) currency pair. It uses an exponential moving average crossover to determine when to be long and when to be short. The blue line is a 10-period EMA, and the red is a 20-period EMA. When the blue line is over the red, you are long and vice versa for shorts. In a trending market, this is a powerful setup to take because it allows you to participate in the large move that often follows this signal. The first arrow shows a false signal while the second shows a very profitable signal.

Figure 1

This is where the power of anticipation comes into play. The active trader typically monitors open positions as they play out to see if any adjustments need to be made. Once you had gone long at the first arrow, within three bars you would already be down more than 100 pips. By placing your stop at the longer-term trend moving average, you will probably want to be out of that trade anyway, as a potential reversal might be signaled. On the second arrow, once you were long, it would only take a few days before this trade went in your favor. The trade management comes into play by trailing your stop up to your personal trading style. In this case, you could have used a close under the blue line as your stop, or waited for a close underneath the red line (longer-term moving average). By being active in position management - by following the market with your stops and accepting them when they are hit - you are far more likely to have greater returns in the long run than you would be if you removed the stop right before the market blasted through it. (For further reading, check out Trailing-Stop Techniques.)

Figure 1 illustrates the difference between anticipation and prediction. In this case, we are anticipating that this trade will have a similar result based on the results of previous trades. After all, this pattern was nearly identical to the one that worked before, and all other things remaining equal, it should have a decent enough chance to work in our favor. So did we make a prediction about what would happen in this case? Absolutely not - if we had, we wouldn't have put our stop-loss in place at the same time the trade was sent. Unlike anticipation, which uses past results to determine the probability of future ones, making an accurate prediction often involves a combination of luck and conjecture, making the results much less, well, predictable.


ADVERTISEMENT
In this exclusive must-read free report compliments of ChartAdvisor.com you’ll learn 5 of the most reliable chart patterns for delivering explosive and profitable trading ideas.


Limited Emotion
By monitoring the trade(s) in real-time and adjusting accordingly, we ensure that emotions aren't able to get the better of us and cause a deviation from the original plan. Our plan originated before the position was taken (and thus had no conflict of interest) so we use this to look back on when the trade is active. Since we already have a plan that involves no emotion, we are able to do as much as possible to stick to that plan during the heat of battle. Make a point of minimizing emotion, but not completely removing it. You're only human, after all, and trading like a robot is nearly impossible for most traders, no matter how successful they are. We know what the market will look like if our anticipation both does and does not occur. Therefore, by using the chart above, you can see where the signals clearly did and did not work as they were happening based on the price action of each bar and its relation to the moving averages. The key is to take ownership of your trades and act based on your trading plan time and time again. (For more insight, see Ten Steps To Building A Winning Trading Plan and Having A Plan: The Basis Of Success.)

Conclusion
Objectivity is essential to trading survival. Technical analysis provides many views of anticipation in a clear and concise manner, but as with everything else in life, it doesn't provide a guarantee of success. However, by sticking to a trading plan day in and day out, our emotions are minimized and we can greatly increase the probability of making a winning trade. With time and experience, you can learn to anticipate the direction of your trades and improve your chances of achieving better returns.

The Ups And Downs Of Biotechnology

Many traders dream of the day they can close out their positions and realize that one big gain. You probably have heard stories about novice traders that build up their trading accounts from mere thousands into millions. Biotechnology is a sector where traders seek out these such huge profits. For smart traders, this sector can present an incredible area of opportunity, but for those who are not willing to do their homework, it can be a train wreck waiting to happen. In this article, we'll use real-life examples to illustrate why this sector can be so appealing, and what issues you should consider before putting your capital at risk.

The Big Win
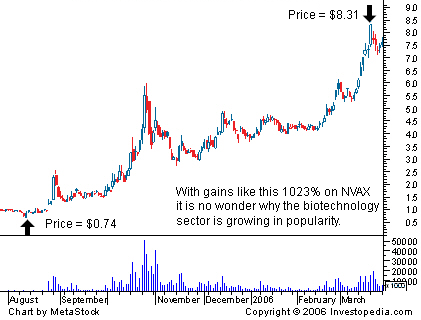
There are few sectors in the market that see small single-product companies go from having tiny market capitalizations to having a worth over hundreds of millions practically overnight. The business of curing diseases can be a lucrative one, and investors will jump on the bandwagon for any stock that shows the promise of a big breakthrough. For example, as you can see in Figure 1, Novavax Inc. (NVAX) rose from a low of $0.74 in August 2005 to a high of $8.31 in March 2006. This is equal to an amazing 1,023% in seven short months. With gains like this, it is easy to see why so many are anxious to put money into this sector.

Figure 1

It's Not All Roses
You just can't plop down your $10,000 and come back in seven months to collect $102,300 always. Along with the opportunity to make huge gains comes the potential for some very devastating losses. Because most of the companies in this sector are relatively small, most with no more than two or three products, news releases about their clinical trials and/or concerning approval from the Food and Drug Administration (FDA) become the main factors deciding the direction of the company's stock. Companies in this sector live and die by these announcements.

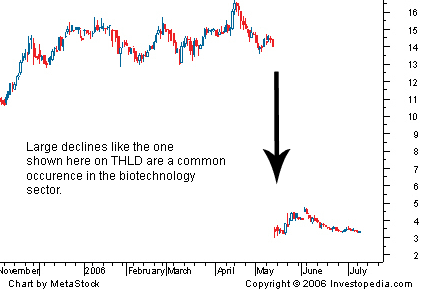
For example, investors of Threshold Pharmaceuticals (THLD) saw the price of their shares travel to a high of $16.98 in mid-April 2006 only to fall to a low of $3 in mid-May 2006. The major fall was attributed to the termination of the company's clinical trials upon the FDA's request. The 82% drop in roughly one month is a good example of what can happen when a company releases this type of bad news.

Even worse, notice in Figure 2 how the stock gaps down. This means that you have no chance of cutting losses once you've entered the trade. For example, let's say that you bought the stock at around $15 and had a stop-loss order in for $13. In theory, the stop-loss should limit your loss to around $2 ($15-$13). In volatile markets like this, however, you can't limit your loss. Your order will get filled at the open price of $3, not the $13 you wanted. (For more insight, see Playing The Gap.)


Figure 2

The Story
Many investors get wrapped up in the story of a small biotech firm and convince themselves that the company's product(s) will revolutionize its industry. Some investors even place money into these types of companies simply because they believe that the complex products seem so impressive that they must work. It's not that impressive-sounding products can't be successful, but rather that it is extremely difficult for the average investor to get a handle on the probabilities of success for a drug. (To learn more, see Using DCF In Biotech Valuation.)

For example, an investor who is researching Micromet Inc. (MITI) on Yahoo!'s Financial page would read that "its drug development platform is based on its BiTE technology, an antibody-based format that uses the cytotoxic potential of T-cells. The company's principal product candidates include Adecatumumab (MT201), a recombinant human monoclonal antibody" (2006).

This might sound impressive, but do you have any idea what the company does? Perhaps those of you with doctorates in biology understand, but for the average Joe (or the average analyst), even understanding the product can be difficult. What this means is that you, the investor, are going to have to do a lot of homework to figure out exactly what the product is, what the company's strategic advances are and what risks are involved in the event that the product does not work. (For related reading, see Introduction To Fundamental Analysis and What Kind Of Research Do Investors Want?.)

Nobody Really Knows, Not Even the Big Guys
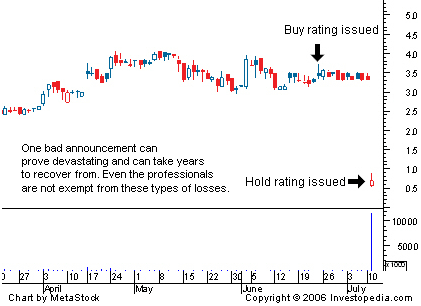
Since the companies in this sector can be very complicated, many traders will turn to large financial institutions for guidance. The buy and sell ratings made by these companies can be used as a tool to determine whether or not an investment decision should be made, but as you can see in Figure 3, they can be totally wrong. In our first example, an investment bank issued a buy rating on Valentis Inc. (VLTS) on June 23, 2006. Eleven trading days later, the company released bad news about its drug and the stock fell a whopping 79% in one day. What did the firm that issued the buy rating do? They downgraded the stock to a hold rating! It makes you wonder how poorly a company has to perform to get a sell rating. (For further reading, check out Analyst Recommendations: Do Sell Ratings Exist?, Why There Are Few Sell Ratings On Wall Street and Stock Ratings: The Good, The Bad And The Ugly.)

Figure 3

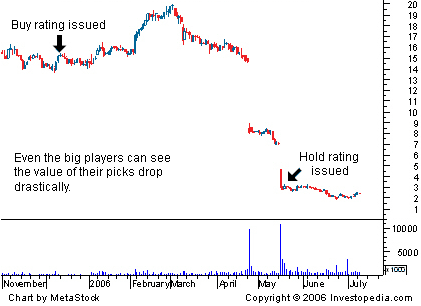
Another example of poor financial institution advice occurred on December 8, 2005, when a large investment bank issued a buy rating on DOV Pharmaceuticals Inc. (DOVP). At this point in time the price was approximately $15, but as you can see in Figure 4, this changed within the next few months as the stock dropped off and hit a low of $2.71. On May 17, 2006, the investment bank came out and (again) issued a hold rating, but this rating was not much help to investors as the stock dropped again, to a new low of $1.85 a month later.

Figure 4

Conclusion
The biotechnology sector is very exciting and can be very rewarding for those who remain cautious and do their homework. However, it is easy to get caught up in the dream of 1,000% gains, or the intriguing stories of how certain companies' products will change the world. It is important to realize that if you are aiming for huge gains in the biotech sector, you likely will encounter some bad trades that will leave you reeling at the reduction of the value of your account. We all know that investors make mistakes and, as shown above, even the big players can see their picks lose most of their value. If the big players can be wrong completely, so can you, so trade with caution and restraint. When it comes to investing in this high-risk sector, it may be wise to use only as much money as you can afford to lose.

By Casey Murphy,
Access Investopedia's Forex Advisor FREE Report - The 5 Things That Move The Currency Market