When it comes to the financial markets, most traders don't hesitate to discuss the trades they've used to turn a handsome profit. But, have you ever noticed that they never seem to talk about their losing positions or the trades that didn't turn out as well as they'd hoped?
| |
Taking an occasional loss isn't something to be ashamed of. In fact, it should be seen as a learning experience. And although traders may want to spare their egos and avoid sharing their bad trading experiences with others, at ChartAdvisor.com, we feel that these trades can be just as valuable as the winning ones. Read on to find out how swallowing your pride and examining your worst mistakes can help you prevent them from happening again. (To learn the basics to technical analysis, see our Technical Analysis, Analyzing Chart Patterns and Exploring Oscillators and Indicators tutorials.)
The Pattern
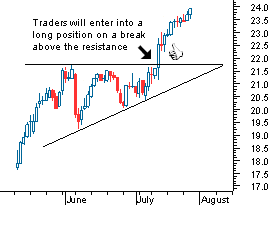
On January 30, 2006, ChartAdvisor.com identified a potential ascending triangle forming on the chart of Global Crossing Inc. (GLBC). This ascending triangle pattern, as illustrated in Figure 1, illustrates how the pattern develops in an ideal situation.
 |
| Source: MetaStock |
| Figure 1 |
Notice how the first trendline is drawn horizontally at a level that has prevented the price from moving higher on several occasions. The second trendline is drawn so that it connects a series of increasing troughs, which is often thought to represent an increase in demand. It may take the buyers a few tries to push the price past the upper resistance level, but once a breakout does occur, the buyers aggressively send the price of the asset higher. (To learn more, read Continuation Patterns - Part 1 and Triangles: A Short Study In Continuation Patterns.)
The Losing Trade
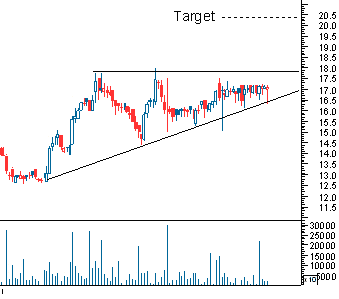
The ascending triangle pattern we identified in GLBC's chart is a signal of a possible break toward our short-term target of $20.41. The thesis behind this trade setup is that a large number of traders would enter orders to buy GLBC once the price was able to surpass the resistance of $18.06 - a level that had prevented the bulls from pushing the price higher several times over the past few months.
 |
| Source: MetaStock |
| Figure 2 |
Like all traders who use the ascending triangle chart pattern, we were expecting to see the price of our identified stock violently make a move toward our target, which is when we would sell the stock and realize a quick and handsome profit of 13%. Ascending triangles are many traders' favorite pattern because it is not uncommon to see a stock hit a target price set 10-20% away from the entry only days after the breakout.
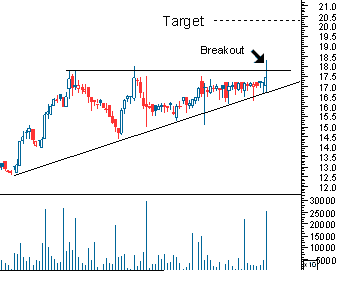
As you can see in Figure 3, the much anticipated move above the entry price came on March 1, 2006. To our dismay, it was not a sharp move higher as we had hoped. Actually, the breakout represented a worst-case scenario - the bears quickly responded to the move and pushed the price back below the entry later in the day.
The Response
This is where the story turns to one of risk management. At ChartAdvisor.com,we attempt to cut our losses at a standard 3% below the entry price. This ensures that if the move above the entry is indeed a failed breakout, we will be out of the position before the other bulls decide to follow suit and push the price of the asset substantially lower, resulting in much bigger losses.
 |
| Source: MetaStock |
| Figure 3 |
In this specific trade, our strict risk management strategy took us out of our position on the exact same day that we had entered it, resulting in a small 3% loss. At ChartAdvisor.com we adhere to the theory of letting profits run while quickly cutting off a losing trade before it can cripple our returns. However, although this strategy prevents devastating losses, it can also cause traders to miss out on substantial gains if the investment thesis proves to be correct at a slightly later date. This is exactly what happened in the GLBC trade. Should we have carried out this trade any differently?
The Aftermath
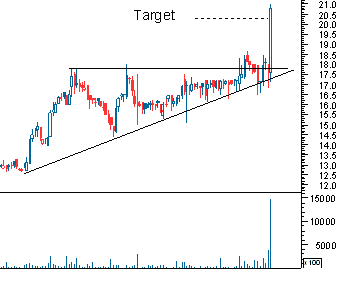
The frustration of having a trade go against you after you've watched it develop for days, weeks or even months can be agonizing, but sometimes this feeling can get worse when you see what happens after you've exited your position or taken the pattern off your radar. In our example, the move higher that we were expecting came twelve trading days after we were taken out of our position.
 |
| Source: MetaStock |
| Figure 4 |
Clearly, we missed the boat on GLBC, but this missed opportunity is not a worst-case scenario - we know that this trade could easily have gone the other way, resulting in a major loss.
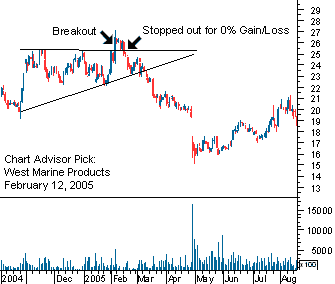
As you can see from a different ChartAdvisor.com recommendation, West Marine Inc. (WMAR) in Figure 5, a tight exit stop loss strategy has its purpose. In this case, we managed to avoid holding onto a position that continued to move lower after we chose to exit. We continued to stick to our strategy so that we could attempt to eliminate the chance of holding a stock like WMAR through large declines, while also giving us exposure to sharp breakouts like the one seen on GLBC. We may not catch them all, but over time we are confident that we'll catch our fair share of these profitable moves and have a strategy that will outperform many others.
 |
| Source: MetaStock |
| Figure 5 |
A Lesson Learned
Looking back with hostility on trades that did not turn out as expected is a normal reaction, but failed trades can provide critically important lessons for traders. Traders must learn to stick to their strategies and be willing to examine trades like GLBC. Only then can they discover whether an underlying thesis regarding a particular trade was correct. In the case of GLBC, the chart pattern did correctly predict a sharp move higher. Often you will find that little more than bad timing and an unlucky set of circumstances stands in the way of a very nice profit, vindicating your continued resolve to sticking to your strategy.
|
So should we have held on to the GLBC trade? Not a chance!
Conclusion
Unlucky trades happen to every trader regardless of experience; the only difference is that the best traders brush off short-term losses and missed opportunities without dwelling on them and realizing that it is how they react to future setups that will determine their success in the trading game over the long run. At ChartAdvisor.com, we believe that by using chart patterns such as the ascending triangle, traders can put the probability of capturing extreme short-term moves on their side without taking on too much risk. Not all trades will work out as planned, but traders will still be able to make impressive returns, particularly if they are able to learn from past mistakes.
To read more of ChartAdvisor.com's trader mistakes and glories, see Tales From The Trenches: Don't Count On Luck.
By Casey Murphy,
Access Investopedia's Forex Advisor FREE Report - The 5 Things That Move The Currency Market
Casey Murphy is the senior analyst at ChartAdvisor.com. He contributes educational articles to Investopedia.com and is a graduate of the University of Alberta School of Business. ChartAdvisor is an independent technical analysis service dedicated to uncovering explosive short-term trading opportunities for individual investors. To learn more about how you can start a free trial and put Casey's insightful analysis and expert pattern recognition to work for you, click here now.
No comments:
Post a Comment